


Traders pay close attention to economic indicators which can have a direct, and somewhat predictable, effect on the values of a nation's currency, stocks, and commodities. Some are "lagging indicators" that confirm or refute what we thought we knew. Others are "leading indicators" that can be read as signals of trends to come. In any case, they move the markets, some more than others. The following is an overview of the most important economic indicators that influence the financial markets, and what they can tell you.
How to Use this Economic Indicators Guide
To get the most out of this guide, it’s recommended to practice trading market volatility around macroeconomic data releases. The best risk-free way to test these strategies is with a demo account, which gives you access to our trading platform and $10,000 in virtual funds for you to practice with.
Once you’ve found a strategy that consistently delivers positive results, it’s time to upgrade to a fully funded live account where you can apply your newfound edge.
Why do Economic Indicators Matter for Traders?
Economic indicators influence currency prices because they’re barometers of the following:
- The health of the underlying economy: That means increased demand for that economy’s currency from exports and foreign investment in local hard assets like businesses and real estate.
- The direction of interest rates and central bank policy: Faster growth makes inflation more likely and thus further rate increases more likely because:
- Central banks use rate increases to reduce inflation risk
- They like to raise rates in times of growth to allow room to lower rates when their economies start slowing and need a boost.
For example, the underlying fundamentals of a currency don’t have to be objectively good, just better than enough of the others, and voila, you have an up-trending currency pair.
Which economic indicators are most important?
Here are some guidelines:
- The more directly it affects interest rate expectations, the more influential it is: Because economic conditions change, some economic indicators become important to central bank policy.
- What most affects rate expectations varies over time and place: During recessions, when inflation is less of a concern, growth-related data like GDP, jobs, consumer spending, etc., become most important. In boom times, when inflation is more of a concern, inflation data like the CPI and PPI become more important.
If the central bank of a large economy indicates what macroeconomic data are most important in guiding its rate policy, these data become a market focus.
- The larger the economy, the more important the data: Major fundamental data from the largest economies like the United States, the European Union, China, and Japan are more influential on global economic health, and forex markets than data of smaller economies like Switzerland, New Zealand, or Canada (beyond their effects on the related forex pairs).
- Influence varies with the type of economy: For export-based economies like Japan and Brazil, Russia, India, and China (the BRIC nations), data on exports and industrial production are more important than for nations for which GDP is more based on consumer spending and financial products like the United States and the United Kingdom.
Important economic indicators to follow
Rather than focusing on each of the key fundamentals, we’ll provide a brief listing of the economic indicators and data to watch and research as needed. Details of these may vary from country to country. You’ll find abundant free resources about them online. You need not memorize them. Rather, check any good online economic calendar which ranks events by importance and includes explanations of the significance of the data.
Gross Domestic Product (GDP)
GDP is the most important measure of the overall health of an economy. The compilation process for GDP takes such a long time that when it is finally released, many parts of it are already known. So, often, expectations turn out to be quite accurate. But if there are some surprises in store, they can have a large impact on the market.
Typically, there is an advanced or preliminary reading about four weeks after the quarter ends, and a final one about three months after the quarter ends. The preliminary reading is what carries the most influence because the final reading rarely deviates from it.
Non-Farm Payroll (NFP)
Again, the more important the economy, the more important the report. Jobs take on even greater significance in economies like the United States or the United Kingdom, where consumer spending is a more important component of GDP than manufacturing or exports.
Non-Farm Payroll (NFP) is possibly the most important economic indicator for forex traders, released by the United States Bureau of Labor Statistics, on the first Friday of every month. The reason this report has such a significant impact on forex, stocks, and oil or gold prices is that historically, the NFP employment data is closely correlated to the GDP and, therefore, can be used as a timely indicator of the US GDP. In addition, this report affects the nation’s monetary policy, given that stable prices and maximum employment are two of the Three Monetary Objectives of the Federal Reserve.
Federal Funds Rate
Another US-based indicator, this one is released by the Federal Open Markets Committee (FOMC), a committee in the Federal Reserve System. Its responsibilities include making key decisions regarding the growth of the US money supply as well as interest rates.
The committee meets eight times a year, as part of its schedule to determine the US monetary policy. The outcomes of these meetings can directly impact the forex market. Statements that are released after each meeting serve as a guide for the Federal Reserve regarding the future course of its monetary policy.
If the FED changes the Federal Funds Rate or the perception regarding its direction of monetary policy, it affects the US dollar. And, since the USD is the reserve currency of the world, this has a cascading effect on other currencies.
Consumer Price Index (CPI)
Also known as CPI, this is a measure of the goods and services and is index-linked to a base starting point. It gives us an idea about how quickly prices are rising or falling. This information is important since price stability is part of the US Fed’s dual mandate.
Since inflation is directly related to monetary policy, the CPI report can have a huge impact on the forex markets. Again, it is the deviation from the predicted results that usually has the greatest impact.
For instance, if the value of CPI is much higher than expected, it signals that going forward, monetary policy will be tightened. All other things being equal, this can be bullish for the US dollar.
Retail Sales Report
The Advance Monthly Sales for Retail Trade, known simply as Retail Sales, is two weeks into each month by the US Census Bureau (a division of the US Department of Commerce) at 08:30 ET. This report gives an estimate of the nominal dollar value of retail sales, along with the percentage change in the figure from the previous month.
Most traders follow the percentage change data more than the other contents of the report. If there is a large divergence between expectations and the reported figure, it can have a significant impact on market prices.
Another reason why this report is so popular is due to the Personal Consumption Expenditures (PCE). PCE is considered a major contributor to the growth of the American economy.
Unemployment Rate
In simple terms, the unemployment rate can be defined as the percentage of the labor force involved in an active search for jobs. During periods of recovery, unemployment data acts as a lagging indicator. Unemployment is also closely linked to consumer sentiment. An extended period of unemployment is extremely destructive for consumer sentiment since it affects consumer spending and overall economic growth.
Other things being equal, a weakening US labor market is usually considered bearish for the US dollar.
ISM Report On Business
The ISM Report On Business – Manufacturing (PMI) and Services (PMI) or Non Manufacturing – are two of the most reliable economic indicators available, providing guidance to supply management professionals, economists, analysts, and government and business leaders. The reports are issued by the ISM Manufacturing and Services business survey committees.
The ISM Report On Business continues to be consistent and accurate in indicating the direction of the overall economy, in addition to the manufacturing and services sectors. The reports are available on the first and third business day of each month.
Industrial Production Index
This indicator measures the level of US output (in terms of material produced), as compared to a base year, in three broad categories – mining, manufacturing and gas/electric utilities. The US Fed compiles the data and creates this report, which is published by mid-month, each month. Some part of the index data is from hard data (directly from industries or official surveys), but this may not be available every month.
Housing data
This includes a range of monthly reports like housing starts, new home sales, existing home sales, new building permits, etc. Considered an indicator of what stage the economy is within the current business cycle. It is also a sign of the health of the banking sector and consumer lending, consumer spending, and jobs, given the significant impact housing has for these sectors. Remember that the Great Recession that began in 2007 started with irresponsible and excessive mortgage lending that created a real estate bubble ending in what became known as the subprime crisis. This in turn, leads to a banking solvency and liquidity crisis, which spread and essentially crashed much of the developed world’s economies.
Other Economic Indicators
There are various other key economic indicators that are worth following, such as inflation rate, durable goods orders, initial jobless claims, Consumer Confidence Index, central bank policy statements and sentiment surveys. So, make sure you have an economic calendar handy to keep track of upcoming announcements and reports.
Again, you could follow more indicators and reports, but these are enough to get you started. As you develop your trading style and preferred news and fundamental analysis sources, you’ll develop your own list.
Where to follow the Economic Indicators and how to read it
With CAPEX.com, you can stay on top of upcoming market-moving events with our economic calendar.
An economic indicator calendar is used by investors to monitor market-moving events, such as economic indicators and monetary policy decisions. Market-moving events, which are typically announced or released in a report, have a high probability of impacting the markets.
An economic indicator calendar is usually displayed as a chart showing the days, weeks, and months of a particular year. Each day lists several market-moving events or drivers in chronological order, giving investors time to research and anticipate the specific release of interest to them.
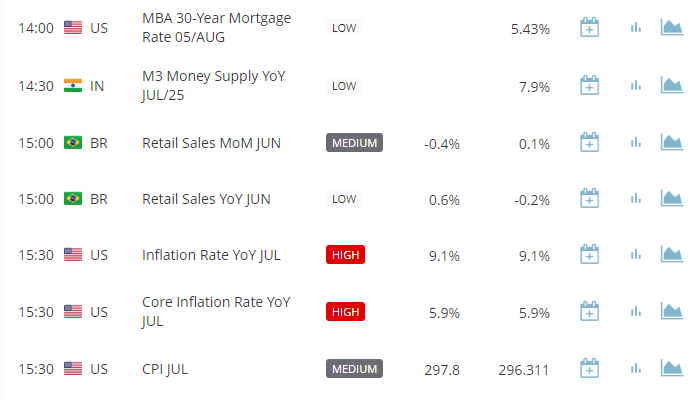
Volatility Levels
An economic indicator calendar not only lists daily events but the volatility levels attached to them. A volatility level refers to the likelihood that a specific event will impact the markets. Economic calendars usually have a three-scale volatility gauge. If an event has a level one volatility, it is not expected to significantly affect the markets. An event with a volatility level of two is expected to impact the markets moderately, depending on other factors (e.g. other market-moving events, political factors, news items, etc.). An event with a volatility level of three is expected to have a significant impact on the markets. Highly volatile events are often the most closely monitored and the most important economic indicators.
Below are some examples of level one, level two, and level three events:
Volatility Level One
- Current Account
- Foreign Portfolio Investments
- Bill Auction
Volatility Level Two
- Purchasing Managers’ Index
- Retail Sales
- Industrial Production
Volatility Level Three
- Monetary Policy Announcement
- Consumer Price Index
- Employment data
Investors should also note that large, economically powerful countries usually have the biggest impact on the markets. In this case, an economic indicator released by a smaller country may not have the same impact as one released by a bigger country. For example, Turkey's economic indicators are unlikely to impact the markets except for the USD/TRY currency pair and other Turkish Lira pairs, and some calendars will have it listed as a level one event. By contrast, consumer price index data from the United States or Eurozone will have the biggest impact on the markets. Countries and economic regions that tend to impact the markets the most are the United States, Eurozone, Japan, and the United Kingdom.
Volatility levels are usually expressed with LOW, MEDIUM, or HIGH marks.

Event Frequency
Events listed on the economic calendar are released at different intervals, depending on the nature of the event. Events usually occur weekly, monthly, and quarterly (i.e. every three months). The frequency of the event also varies with each country and region.
Generally, most events occur monthly. Few events are released quarterly and even fewer are released weekly. Below are some examples.
Weekly Events
- Initial Jobless Claims (US)
- Business Outlook (Bank of Canada)
- M3 Money Supply (European Central Bank)
Monthly Events
- Unemployment Rate
- Consumer Price Index
- Building Permits
Quarterly Events
- Gross Domestic Product (GDP)
- Business Outlook (Bank of Canada)
- M3 Money Supply (European Central Bank)
Using economic indicators to predict market movements
It’s important to know that you probably should not use the macroeconomic indicators listed here as a sole source for your trading or investment decisions. There are a few steps to take if you want to predict market movements more accurately. The first step is to research the market and make sure you understand what causes price fluctuations.
For example, if you want to trade the USA500, it’s important to know how indices work and learn more about the sectors represented in the index. Once you’ve done this, you should do a thorough technical analysis and take the appropriate fundamental factors into account. Only then could you consider if there is any correlation between one of the unusual economic indicators and the market you’re trading.
Remember that you also need a good trading plan, which will outline exactly what your aims are, how much capital you have at your disposal, and what your appetite for risk is.
Predicting market recovery
Making a prediction about market recovery in any situation can be challenging, as there are many variables to consider. However, you can look at historical events and identify the statistical likelihood of a market rebounding within a certain amount of time.
You can use CAPEX Webtrader’s charts and technical indicators to help you identify recognizable patterns within financial markets. Remember that market fluctuations can happen completely unexpectedly, which is why your trading plan is so important.
Macroeconomic indicators summed up
- Macroeconomic indicators are statistics or data readings that reflect the economic circumstances of a particular country, region, or sector
- Macroeconomic indicators will vary in their meaning and the impact that they have on the economy
- Macroeconomic indicators are important to any trader because they can have a significant influence on market movements
- Most macroeconomic releases happen on specific dates, which means that traders and investors can prepare for their release and the subsequent market volatility
- You can use CAPEX.com’s economic calendar to prepare for data releases
- Popular economic indicators include GDP growth rates, the Consumer Price Index (CPI), and labour market statistics
- The importance of data can vary from country to country, so it is important to know key indicators by region
Free trading tools and resources
Remember, you should have some trading experience and knowledge before you decide to trade market volatility around macroeconomic data releases. You should consider using the educational resources we offer like CAPEX Academy or a demo trading account. CAPEX Academy has lots of free trading courses for you to choose from, and they all tackle a different financial concept or process – like the basics of analyses – to help you to become a better trader.
Our demo account is a great place for you to learn more about leveraged trading, and you’ll be able to get an intimate understanding of how CFDs work – as well as what it’s like to trade with leverage – before risking real capital. For this reason, a demo account with us is a great tool for investors who are looking to make a transition to leveraged trading.